A description goes in, a picture comes out
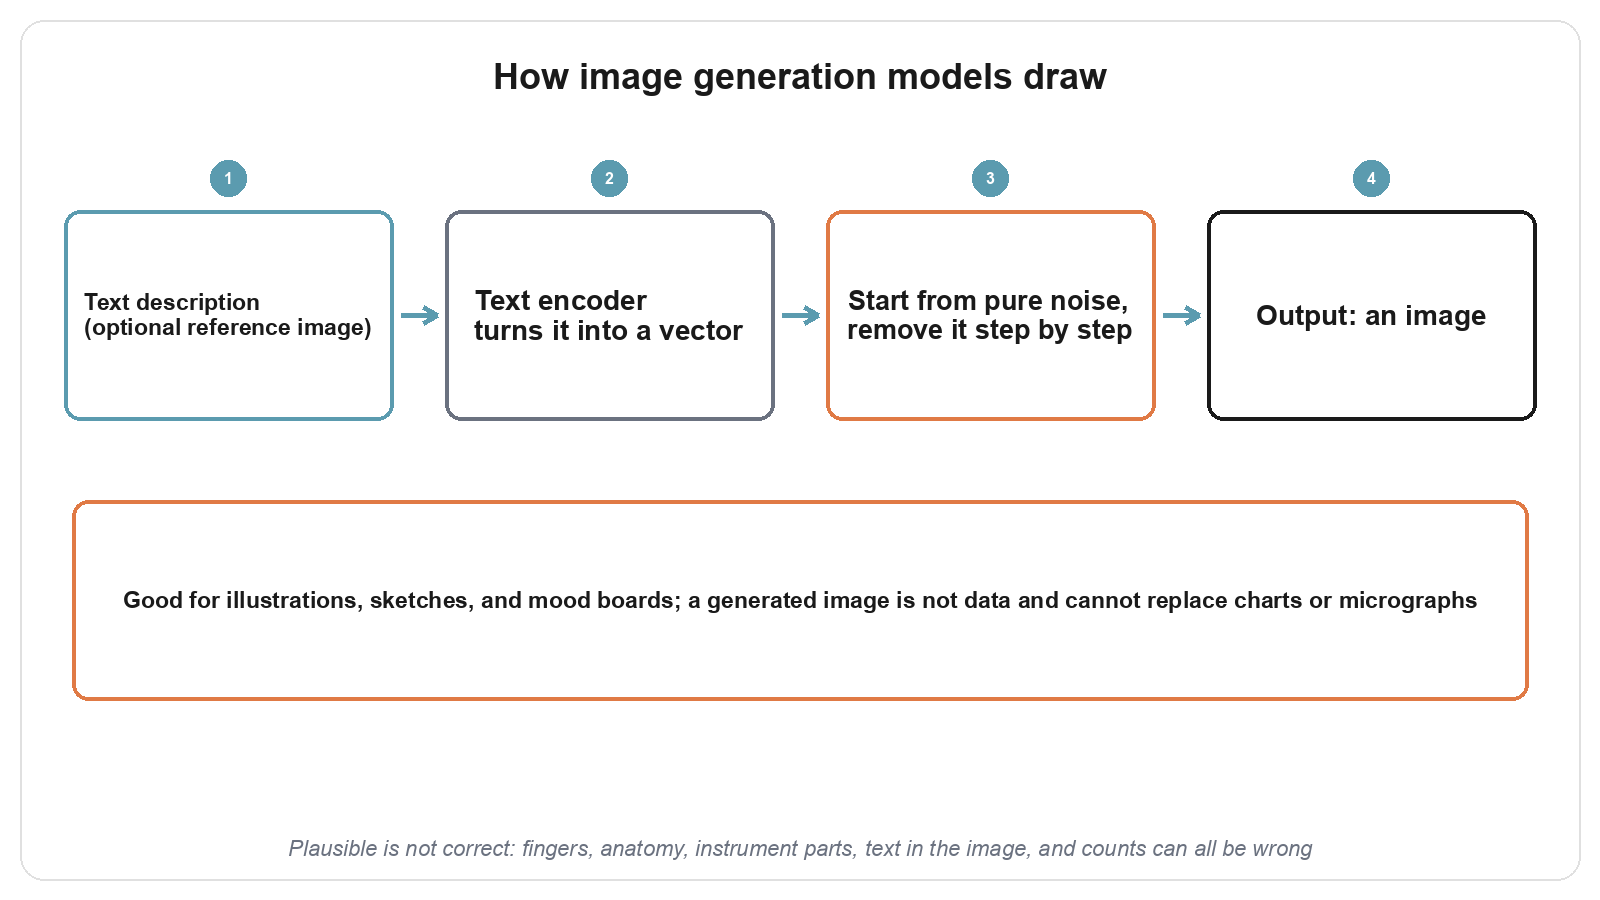
An image generation model reads a text description, sometimes together with a reference image, and outputs a new image.
On a map of AI model types, it sits opposite the vision-language model. A vision-language model looks at a picture and answers in words; an image generator reads words and produces a picture. This piece covers how a sentence becomes an image, what that is useful for, and why the output should never be treated as research data.
Diffusion: learning to remove noise one step at a time
Most image generators in use today are diffusion models, and their training teaches them a single skill: restoring an image that has had noise added to it.
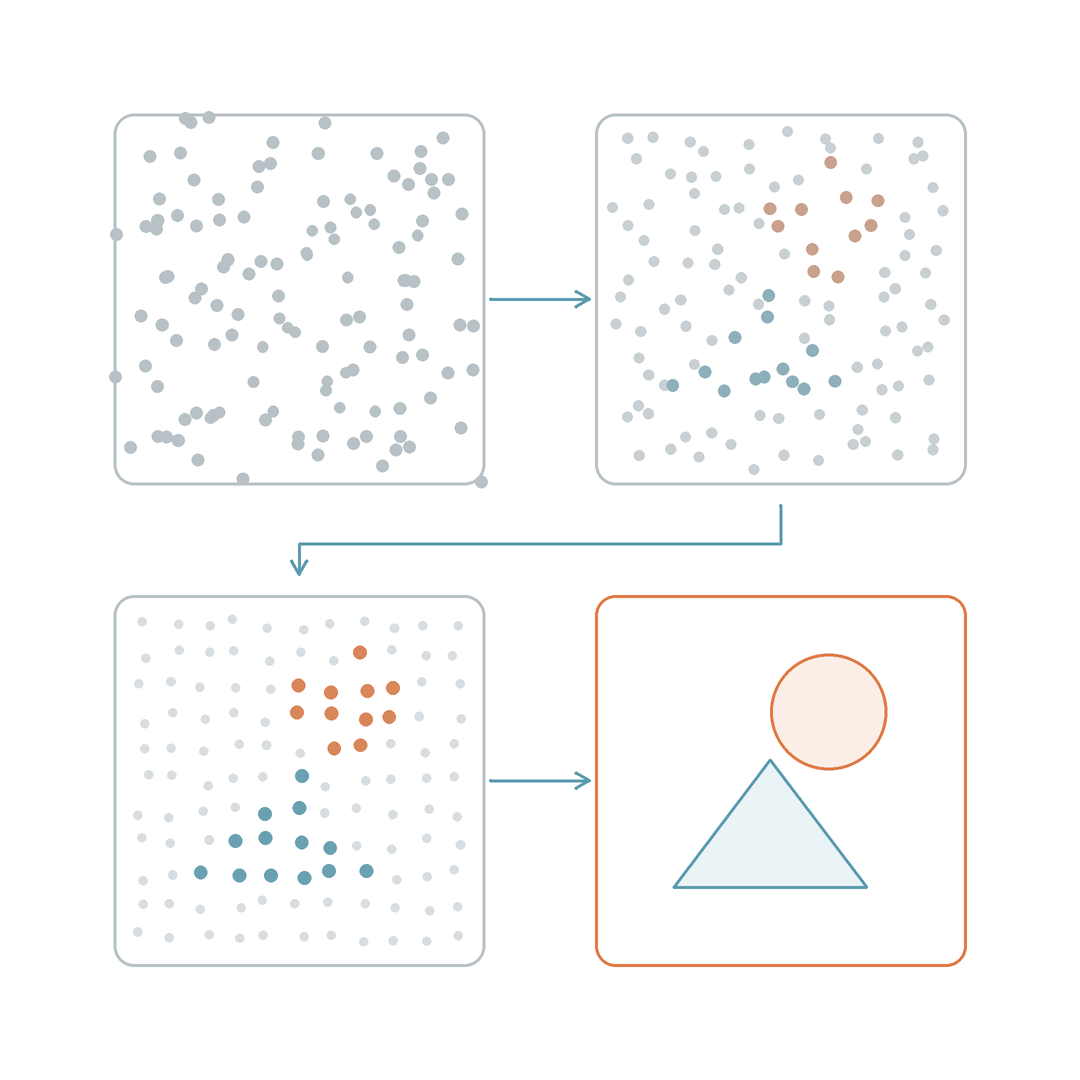
Researchers take a large collection of images and add random noise to each one in small increments until nothing is left but static. The model learns to look at an image at any given noise level and estimate which part of it is noise. Ho and colleagues turned this into a stable training recipe in their 2020 DDPM paper. Generation runs the process backwards. The model starts from pure noise and removes a little at each step, and after many steps a picture takes shape, rather like wiping a fogged-up window until the street behind it appears.
How the text steers each step
The text description tells each denoising step which way to go.
The description first passes through a text encoder, which turns it into a vector of numbers. While removing noise, the model consults that vector to decide whether the emerging shapes should become a cat or a bridge. CLIP, trained on a large set of image-caption pairs from the web, places pictures and descriptions in the same vector space, which makes it one of the embedding models on the map. The method from Ramesh and colleagues in 2022 first turns the text into a CLIP image vector, then draws a picture from that vector.
Latent diffusion, introduced by Rombach and colleagues, moves the denoising into a compressed space. An autoencoder squeezes the image into a much smaller representation, the noise is removed there, and the result is expanded back into a full image. This cuts the compute needed substantially, and many open-source image tools are built on it. In practice, a large language model often writes or expands the description before it reaches the image generator.
What it is good for: illustrations, sketches, mood boards
Image generators are good at turning a vague idea into something people can look at and discuss: article illustrations, concept sketches, mood boards, and cover art.
Say you need a cover for an article about sleep. You might describe "a city late at night, with only a few windows still lit," generate several compositions, pick a direction, and refine it. Here the mood of the picture matters, and whether every detail matches reality does not.
Where it goes wrong: plausible is not the same as correct
The model has learned what pictures usually look like. It does not check whether what it draws is true.
Typical errors include the wrong number of fingers, organs in the wrong place, instrument parts that could never fit together, garbled text inside the image, and four or six objects when you asked for five. A generated image is therefore not data. Charts, micrographs, gels, and stained sections in a research report have to come from real measurements and real imaging; a generated image cannot stand in for them or fill gaps in them. When you publish a generated image, label it as AI-generated and keep a record of the tool and the description you used, so readers can tell illustration from record.
How it differs from its neighbours
The deciding question is whether you need an illustration or a picture someone can check.
- Vision-language models work in the opposite direction, image in and text out. Use one when you need to understand an existing picture.
- Large language models often write or rewrite the description, but they do not draw.
- Embedding models such as CLIP-style text encoders steer the picture from behind the scenes.
- Plotting tools are the right choice whenever you have data. A chart should be drawn from the numbers in R, Python, or a spreadsheet, so every point traces back to a measurement. Asking an image generator to "draw a bar chart" gives you a picture that looks like a bar chart and nothing more.