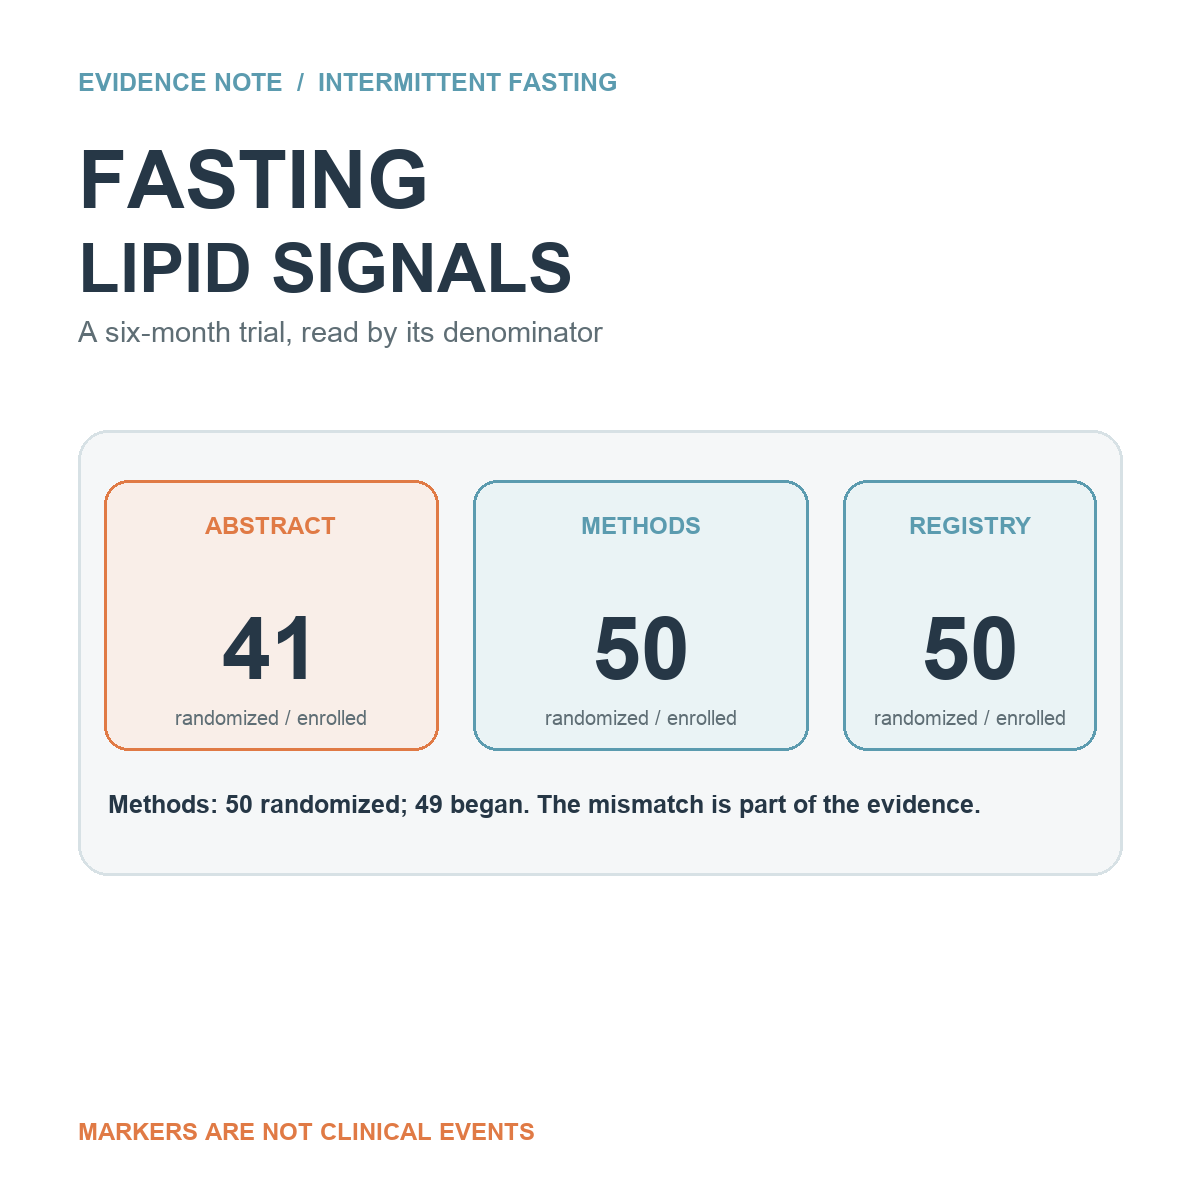
The pooled intermittent-fasting analysis reported a 23.4% decrease in triglycerides, yet the paper's abstract says 41 participants were randomized while its Methods and Results say 50. How should we read that percentage without turning a lipid marker into proof of fewer heart attacks? Start by reconciling the denominator, comparison, and endpoint.[1][2]
The study enrolled adults aged 30-65 years with overweight (BMI 24.8-35). Depending on BMI, participants fasted on two or three nonconsecutive days each week; on fasting days, they ate non-starchy vegetables with dressing, for less than 500 kcal. Participants self-reported an average 22.8% reduction in weekly energy intake, so the observed changes cannot be assigned to meal timing alone.[1]
First, the denominator: 41 and 50 remain inconsistent
The abstract reports 41 randomized; the Methods and Results report 50 randomized, and the trial registry lists an enrollment of 50.[1][2]
The article also says 49 participants began the intervention. The public text does not explain the discrepancy, so 41 should not be relabeled as the number of completers. During the first six months, Group A received intermittent fasting and Group B continued its habitual diet; 21 and 20 participants, respectively, completed that phase. Then 18 Group A completers continued fasting, while 19 Group B completers crossed over into fasting as Group D. The paper pooled the two fasting-exposure periods, A and D. That is like combining two ledger columns: it is not the original concurrent randomized comparison.[1]
Why not read the pooled percentages as a fasting-versus-control difference? Because Group D consists of control participants who crossed over after the first phase; after pooling, the comparison no longer preserves the original parallel randomized arms.
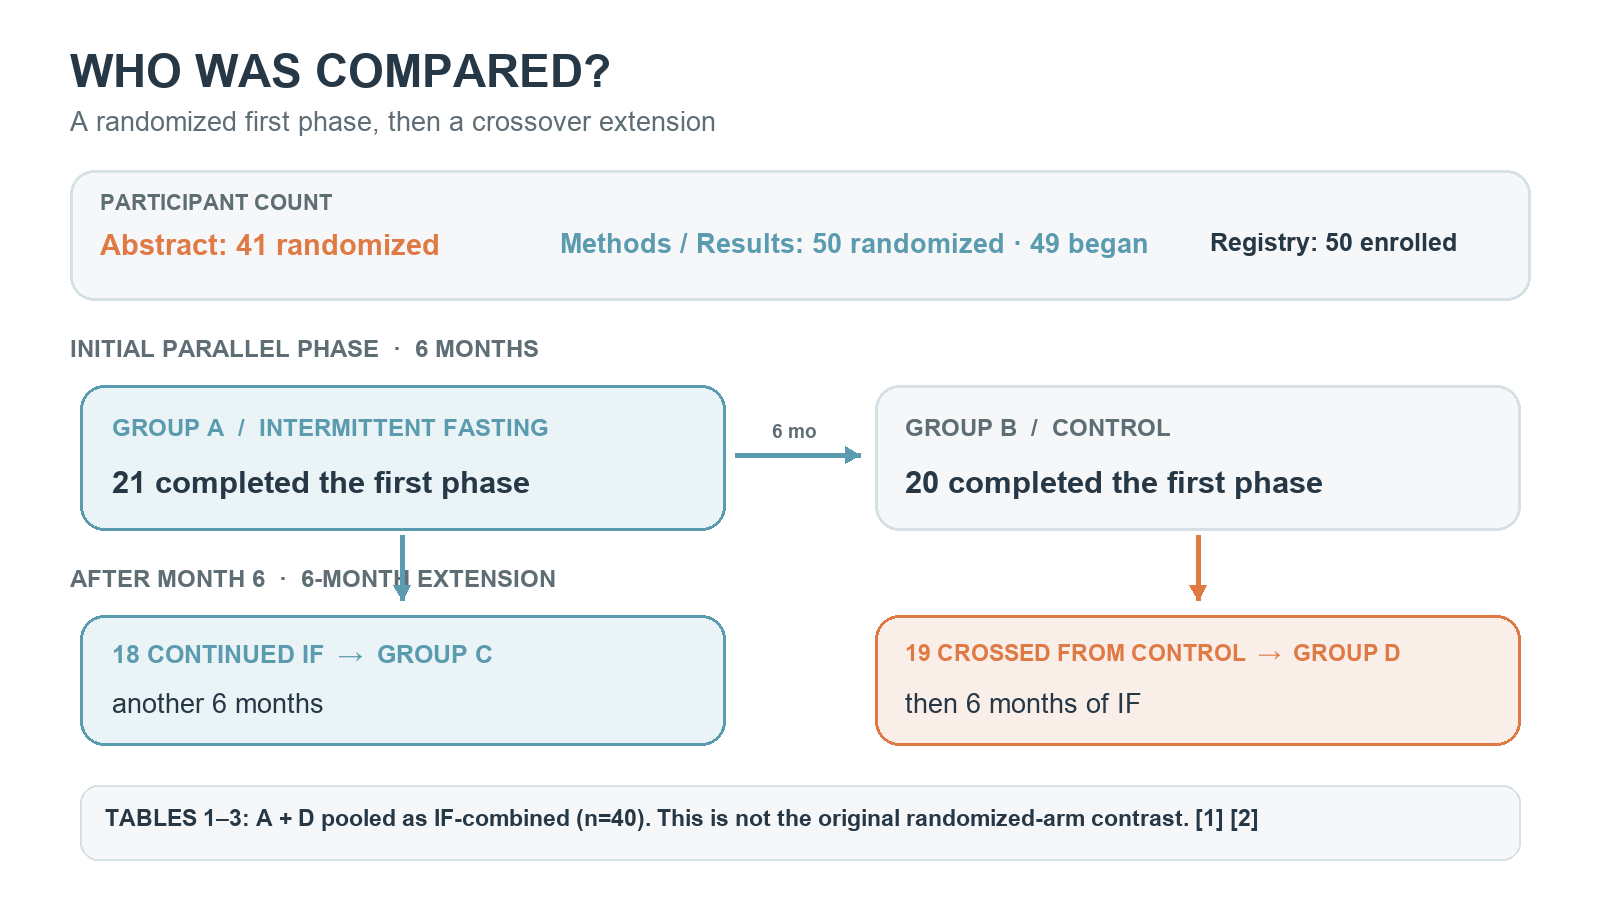
Figure 1. Participant counts and crossover timeline. Arrows show study sequence, not biological causation.[1][2]
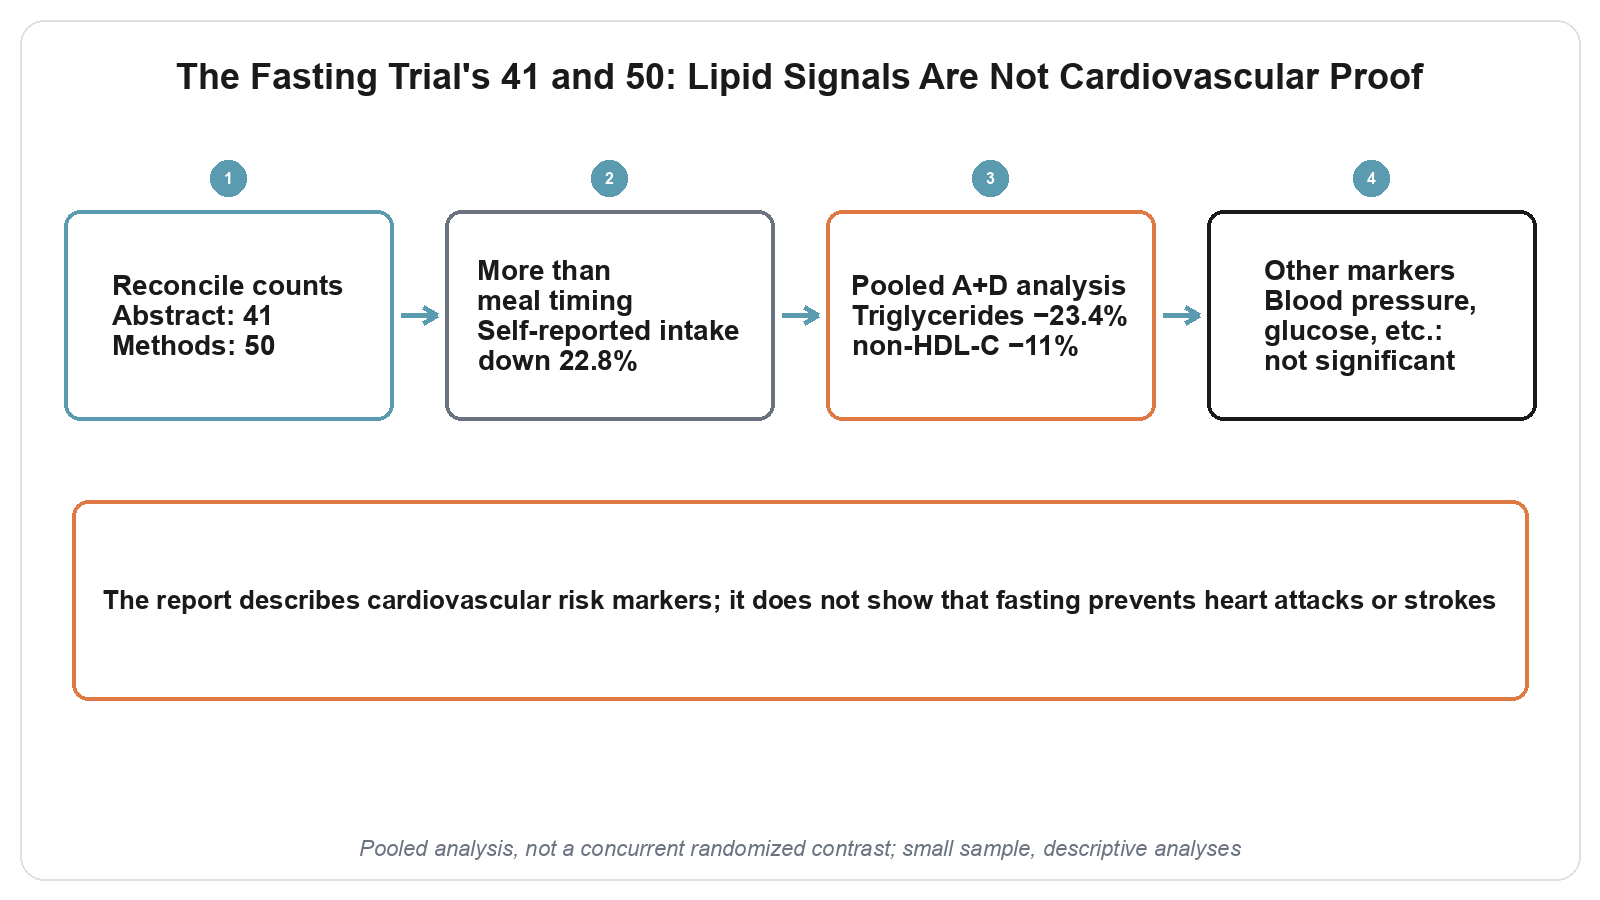
The intervention changed more than meal timing
The protocol also imposed weekly energy restriction, with two or three fasting days according to BMI. The lipid changes therefore cannot be attributed to the clock alone.[1]
Fasting days provided less than 500 kcal, and participants received monthly dietitian visits plus weekly phone follow-up. The reported 22.8% reduction in energy intake was self-reported. Energy restriction and weight change remain plausible alternative explanations, not factors this report ruled out.[1]
Lipid signals did not move every other marker
In the IF-combined A+D analysis, non-HDL-C was 11% below baseline (P < 0.001), and triglycerides decreased 23.4% (P < 0.007). These are results from pooled fasting exposure, not a single difference between two concurrent randomized groups.[1]
HDL-C increased but not significantly. At six months, the report also found no significant changes in blood pressure, fasting glucose, HOMA-IR, inflammatory markers, or carotid intima-media thickness.[1]
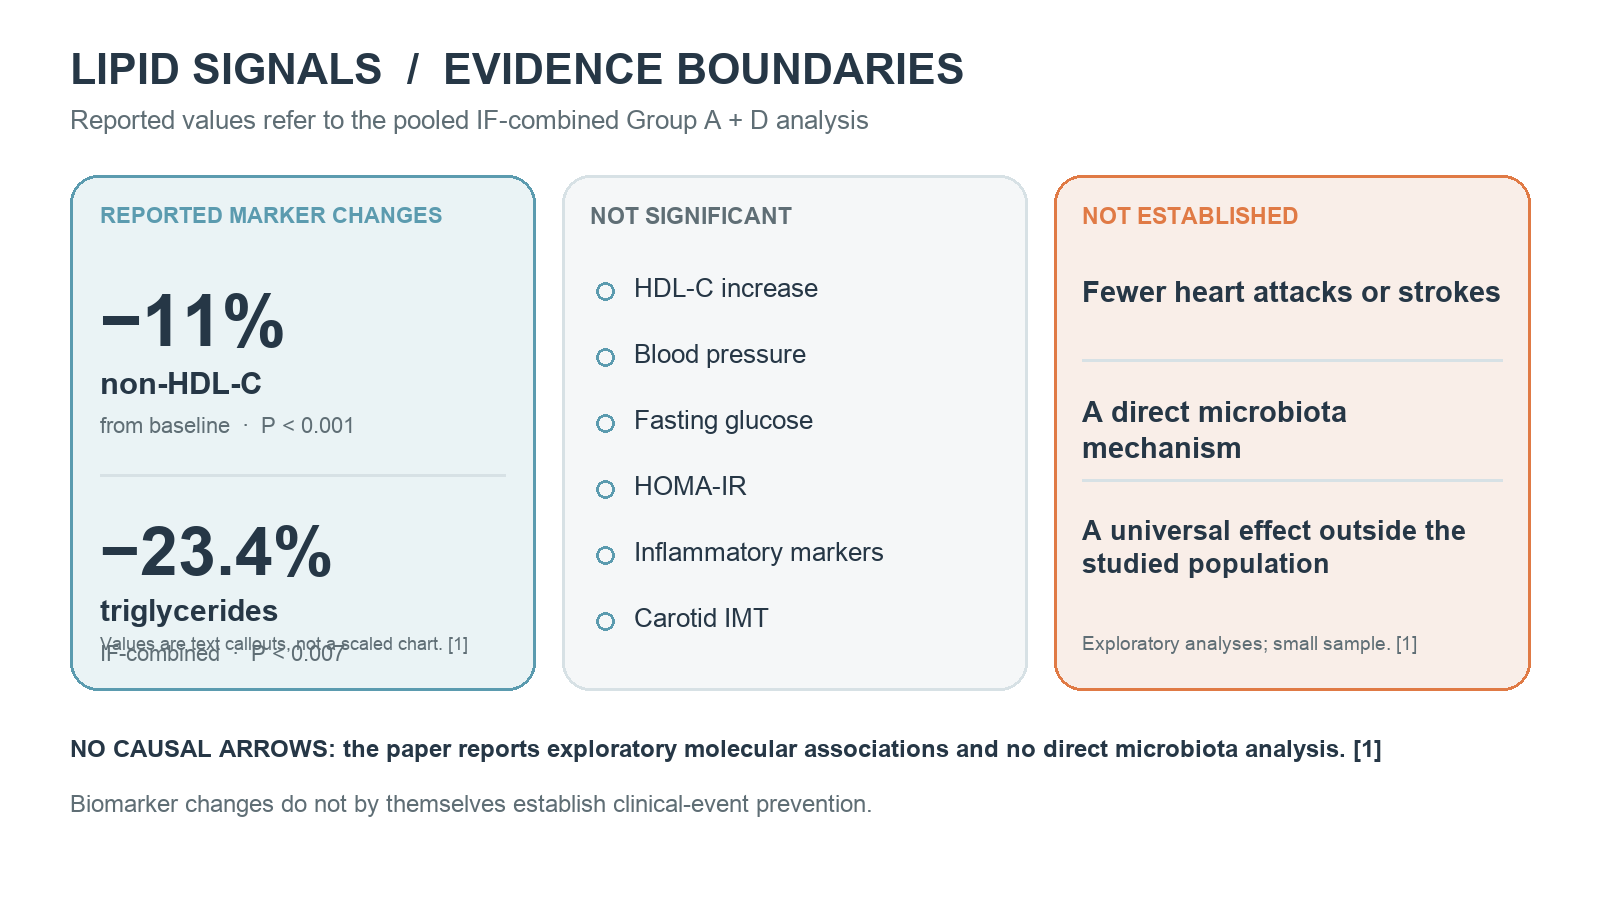
Figure 2. Values are attributed to pooled A+D; changes in risk markers do not establish event prevention.[1]
Narrow the mechanistic and clinical conclusions
This report describes cardiovascular risk markers; it does not show that fasting prevents heart attacks or strokes. The paper presents exploratory metabolomic and transcriptomic analyses, and the authors did not directly analyze the gut microbiota.[1]
The reported association between non-HDL-C and a B-cell/IgA phenotype may suggest a shared mechanism, but it does not show that microbiota changes caused the lipid response. The study applies to adults aged 30-65 years with overweight, and its small sample and descriptive analyses limit generalizability. For readers, these findings are a signal for further testing, not an individual prescription or a substitute for medical care.[1]
Sources
[1] Barve et al., Nature Communications (2025)
[2] ClinicalTrials.gov: NCT01964118