
Best For
This tool is best for people doing real frontend debugging, performance investigation, or Chrome-specific diagnosis rather than general browser automation.
How I Actually Use It
I would not install Chrome DevTools MCP by default just to have another browser tool. Its value is much narrower than that. If a workflow is already covered by Playwright MCP for navigation, screenshots, forms, or ordinary inspection, adding this usually creates overlap.
The reason to consider it is when you need what feels closer to DevTools-grade visibility: traces, deeper network and console inspection, and Chrome-specific debugging context.
Where It Is Strong

- Strongest when performance traces actually matter
- Better fit for deep Chrome debugging than generic automation workflows
- Useful when agent workflows need DevTools-level inspection signals
- More differentiated in frontend engineering than in ordinary browsing tasks
Where It Fails
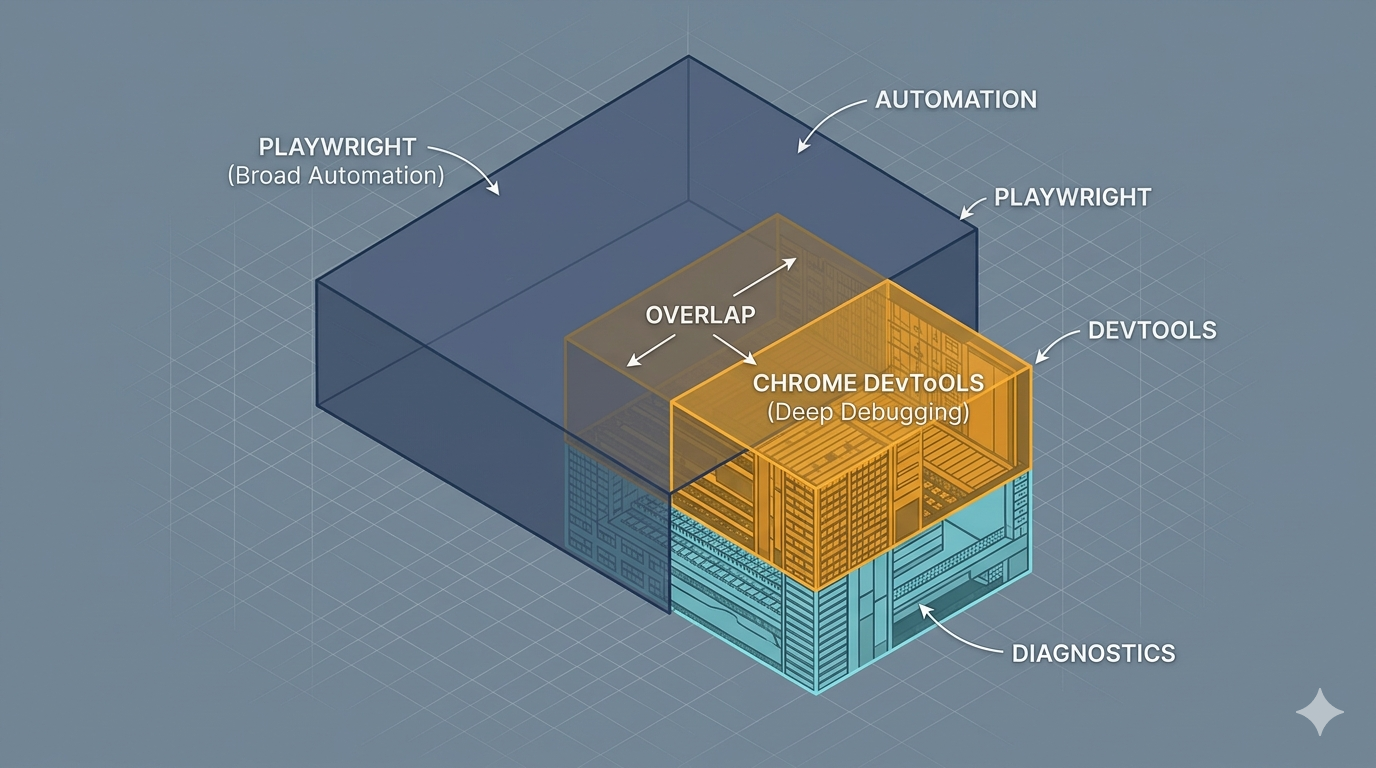
- High overlap with Playwright MCP for common tasks
- Overkill for routine automation, scraping, or screenshots
- Chrome-specific depth is not the same as broad workflow utility
- Easy to install in theory, easy to ignore in practice if you do not need its specialty
Pricing, Difficulty, and Risk
It is open-source, so the real cost is not licensing. The cost is workflow complexity. Another MCP server is only worth carrying if the debugging depth changes real decisions.
Verdict
Treat it as a specialist tool. If you are actively working on frontend performance or difficult Chrome-only bugs, it can be worth adding. Otherwise, Playwright MCP will cover most of what you actually do.